 Unless you are starting a company from scratch – which I will discuss in another article – there is always something more you can do to enhance your business performance. Every company has areas of relative strength and weakness, and the principal goal of business leaders is to find opportunities to “supercharge your P&L”. From my perspective, this is one of the most fun parts of running a business. Combing through data highlighting the operational details of the different business functions looking for opportunities for improvement can be very rewarding. There is almost always something significant that can be done to improve profitability, boost sales, improve quality or improve execution.
To be effective in this exercise, you first must organize yourself. You need data from every functional area. If you don’t have it, creating processes or systems that allow you to get the data you need is the first task! To get started with this discussion, let’s remind ourselves of the somewhat simple formula we need to be successful. In short, we need an increasingly profitable growing share of growing markets. Let’s break this down.
Increasing profits come from:
- High gross margin – low component cost to sales price ratio
- Quality – once sold, the products don’t come back (customers get what they want)
- Operational efficiency – you have a high revenue to employee ratio
- Increasing sales – more of a good thing!
Growing share of growing markets comes from:
- Choosing the right markets in the first place, either by disrupting an existing market with a new product or delivery method or by addressing a new or emerging market
- Development of compelling products and services for your chosen markets through a strong awareness of competitive forces and customer needs and wants in those markets
- Great execution in developing awareness of your value proposition and in the delivery of your products and services to the market (keeping your customers happy)
With these highlights in mind, let’s look at what processes we should go through to analyze the P&L and how we can continually improve a company’s performance.
I prefer to start by creating a database of the invoices from the last 12-18 months including customer names, customer type, region, product type, SKU number, list price, sales price, product cost and shipment date. I have even taken the extra effort to add product attribute information to the data set to allow detailed per market preference and adoption rate trend analysis. This data set typically is derived from the information used in finance for accounting, although you may need to combine several datasets, augment the information or scrub it in order to have a useful coherent package. While for some companies, this data can be somewhat hard to pull together, it is vital to be able to create a dataset that at least approximates each of these fields – even if you have to estimate some parts of the data. If it is hard to pull together today, you need to simplify getting this data form your business systems going forward. Being able to create multiple views of what is going on gives you very valuable information into true current operations and insight as to what you can do to improve the business.
Starting with this data set, in Excel (or other analysis tools) you can create various pivot charts to highlight different aspects of business performance and to evaluate how these aspects might be improved:
- Annual revenue by product and trend through the year – Are some products performing poorly? As you compare what is doing well to what is not, are there any observations that you can leverage to improve the poorer performers (marketing, sales collateral, quality)?
- Annual profit (or loss) by product and trend through the year – Are some products high revenue but low margin? How big an impact to your P&L would a cost reduction be? How can you improve the costs of poorer GM products? Can you raise prices on anything? Does the demand of any of the products support this?
- Annual revenue and profit by market segment and by customer – Are your sales channels performing uniformly? Do you have surprisingly poorer or better performance in one region over others? What can be learned? Do you have any very large customers that stand out? Why is this such a large customer? Are there other customers with similar needs that you can capture?
Other big data analysis tools (such as Tableau) can provide you with ways to analyze and view this data that will give you amazing and very helpful insights. By creating a meaningful database that you can manipulate to provide you with multiple views of the performance of different dimensions of your business gives you a great tool to drive continuous improvement.
Another essential exercise is to perform a similar analysis on data coming from operations. On this side of the business, you will also need to maintain a data set that tracks – by part number – units shipped, unit cost, product lead times, inventory, units scrapped, units returned, units defective in factory and other quality or problem resolution metrics. Metrics on supplier quality, responsiveness and supplier cost will also be needed. These metrics are nominally tracked as manufacturing KPIs. If they are not, you need to put a process in place to capture this data. A review of the manufacturing data set can also reveal great insights:
- Do you have some products that have significant product returns? That have to be repaired internally before they meet quality standards?
- Do some products have excessive lead times? Are some products accumulating in inventory?
- Are your suppliers living up to your expectations? Are they allowing you to meet your customer’s expectations? Are they a competitive advantage for you or a problem?
Typically, because your business will never be perfect – and because, if you are on your game, your ability to improve execution is constantly improving – every time you go through these exercises you will find a new opportunity. However, in the turn-around operations that I have led, the items that have come up with the most immediate opportunity to improve results are:
- Revenue performance will vary by geography and by individual sales person or group. Investigating this, you will usually learn that with improved training and collateral, with added focus on target customers and with strategic changes to personnel, significant improvements can be made to improve sales performance in the poorer areas. A fairly small bit of adjustment can yield significant results.
- There will almost certainly be several products with poorer gross margins and an improvement in these products or services can have a material improvement on the overall business performance. It is often not necessary to re-design the product to make significant improvements. Supplier negotiations, changes in the manufacturing process, a change to components or a simple price increase can be executed quickly and can have almost immediate and lasting impact. Product re-design for cost should also be considered depending on the potential impact. While I favor spending R&D dollars on expanding the addressable markets, re-design of important staple products can often be essential to improve company viability and vitality, especially if the products in question have both cost and quality issues.
- Typically you will find some products with quality issues. This can take the form of product returns, defects found in manufacturing, customer service calls or more vague customer dissatisfaction. Brainstorming on how to address quality issues should include engineering as well as manufacturing (and sometimes sales and marketing, depending on the issue). While extremely important for brand protection, customer satisfaction and company profitability, quality concerns are deferred by many companies. It is critical that these problems be resolved quickly. Identifying any quality issues for large customers or important markets quickly can be very important to your business’ ongoing health. I have often created a focused “quality tiger team” from engineering and manufacturing and quickly identify and eliminate the highest impact quality problems within just a few months, turning around critical situations with key customers.
- Finally, you must comb through the returns and customer feedback information, looking for how to improve your product to better meet your market’s expectations, how to improve your delivery systems or how to enhance your customer services. By ensuring that you are delivering a Whole Product to your market, barriers to sales are minimized. In several of the businesses where I initiated this process, we identified several potentially very large customers, teetering on the edge of leaving us, that became long term anchor customers as a result of a change in how we handled service for them.
- Using a more focused team from engineering and manufacturing, you can explore the profitability of each product in more depth. What components are the key drivers of cost in your products? Are they appropriate? Are you using the best supply chain to allow you to deliver the most value to your customers and the most profit to your business? Can you leverage your supply chain to improve quality? To improve lead times though consolidation?
- A similar focused team from manufacturing and engineering can focus on the forecasting process. Through improved forecasting and communications with sales, inventory turns (cash), revenue predictability and customer lead times can be improved. Further, with better system level data on trends coming from sales, product management and engineering can better drive increased revenue and profits through more targeted development plans.
In a turnaround situation or if you are just getting started with this kind of regular analysis and methodology, you need to take a Pareto analysis approach to identify what to attack first. In other words, you need to focus on attacking what is going to make the most positive impact on your business first. To do this, document all of your findings and estimate the impact of problem resolution for each activity, and stack rank them all. While your estimates may not be entirely accurate, typically the order of magnitude of the opportunities will make sorting easy. In deciding where to start, do not try to attack everything at once. Be sure to limit the number of items that you plan to lead personally. Whatever you lead personally must be executed as a showcase example for excellence and commitment. Also, don’t let other organizational leaders off the hook. Each leader should be delegated to manage one or two important change items from this process and to provide a commitment for a timeline for execution and results.
Once the process has been launched, continuation of this holistic P&L management approach should then become a regular part of business execution. The action items identified should be reviewed for improvement and closure in regular staff meetings or operational excellence meetings. The data sets described earlier should be run on a monthly basis to assess positive (or negative) changes. The finance department should embrace the data analysis for the benefit of the functional groups and the IT team can help to develop data driven dashboards to make ongoing analysis more effective. In quarterly business reviews, you should discuss the key metrics above and look for new areas to improve – in different aspects of your business, in market growth, in operational excellence.
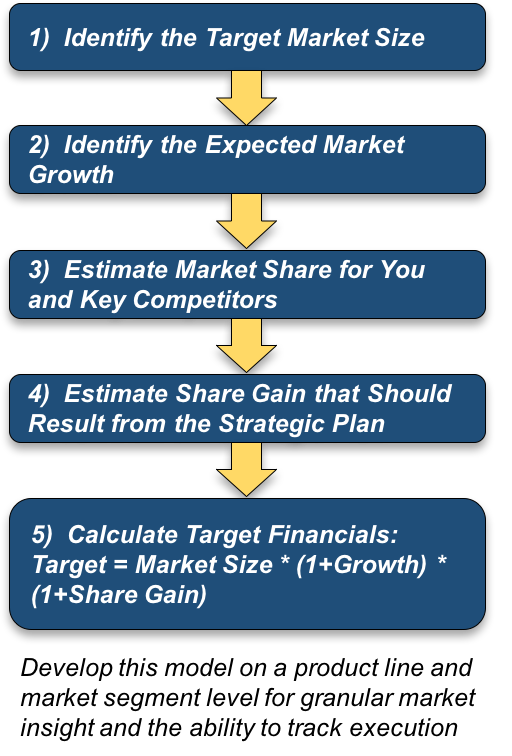
As improvements to the process, year-over-year and quarter-over-quarter performance goals should be established using target market size, market share and annual market growth estimates as the basis. Growth targets for your revenue should be calculated using the expected growth rate (CAGR) plus any targeted share gain you should achieve by out-performing your competition. Benchmarks for functional group improvements and for improvements in operational excellence can be added by using best in class benchmarks based on emerging industry practices. At this point, your P&L management process becomes integrated with your Strategic Management Process.
Managing the performance of your business is a task that is never completed. It is more of an evolving and exciting journey. By working with meaningful data about your own business performance, by harnessing information on the emerging competition and market forces and by putting in place a regular process to focus your energy and execution, you can outperform your competition and put your company in a virtuous cycle of improvement and success.