 Boston Consulting Group Strategic Investment Matrix – This is one of the classic strategic modeling tools and I still find it useful. This assessment model assesses the likely success factors of competing investment alternatives by sorting existing investments according to the industry growth rate of the market, in terms of CAGR, or compound annual growth rate, and the relative market share of the investment. The bubble size for each portfolio item represents the revenue for that item. The idea behind the BCG matrix is that success is strongly linked to cash flow, which is in turn linked to market share and market growth, and assuming efficient operational execution, flows directly to profit.
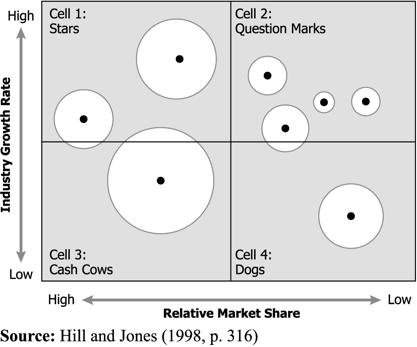
Sorting the various businesses or portfolio items in this matrix provides a visual reference for the opportunity outlook, and the “bubble size” visually indicates relative revenue contribution. The different quadrants of the matrix are labeled based on the market share and growth rate mix as Stars, Cash Cows, Question Marks and Dogs, with rule of thumb approaches for each quadrant:
- Stars: Invest and protect. Maintain and grow share. Improve profitability where possible.
- Question Marks: Invest where you can differentiation and gain share. Create new Stars.
- Cash Cows: Invest selectively to maintain share and maximize profitability.
- Dogs: Minimal investment or divest. But be mindful of how you will replace this revenue.
For example, an investment in a portfolio item in a low growth market, resulting in low market share is likely to return poor results. Alternatively, investments in high growth portfolio items with a likelihood of driving market share up will likely yield very positive results. While this may seem simple, it is also important to allocate investments without prematurely reducing the revenue contributions of existing but relatively inferior investments. It can be very challenging to come up with the optimal strategic allocation of resources when evaluating continued investment in “Cash Cows” (low growth / high share) or in increased investments in “Question Marks” (high growth / low share).
 Notwithstanding some unique situation or mega-trend that would push against the norm, normally investment should be focused on Stars first, the best prospects among “Question Marks” second – to create future stars, and finally, to invest only what is needed in “Cash Cows” to keep them in a high market share position to maintain revenues. However, it may be very valuable to invest in best practices or operational improvements for Cash Cows as such efforts may make dramatic profit increases possible. Another caveat to this is that it is sometimes possible through innovation in technology or creative marketing to rekindle cash cows, pushing them back into higher growth rate markets.
A very pragmatic and useful way to use this tool is to create and examine alternate scenarios for investment. By creating a snap shot of the “current state” of the portfolio and market share, and then creating alternate maps of the future state of what your investments should look like under various investment scenarios can provide a lot of insight. For the scenarios, you could hold CAGR constant, but vary market share and revenue based on the alternatives. This is a great vehicle for debate and brainstorming on what the best alternatives will be. Ultimately the goal is to find you way to selecting the most informed and high probability outcome investments that will provide the best collection of investments to deliver the best overall return for the business. An important side benefit of this work is that you can also identify investments that are complementary across portfolio items, compounding the benefit of these investments (one investment significantly enhances two or three product lines or businesses). Again, this model works well where your business success will come from building market share in higher growth markets. The assumption is that this will drive the optimal cash flow, move through your efficient operations capabilities and generate high profits.
Note that excel plug-ins and templates are readily available for the BCG matrix modeling making the “what-if” analysis mentioned relatively easy to perform. By plugging in various investment scenarios you can gain a lot of insight as to how you should prioritize your strategic investments.