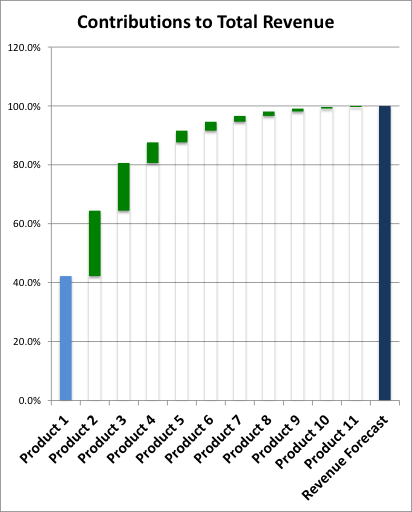
 Pareto Assessments and Priority Management – Pareto is frequently looked at at a tool for operations management. But a Pareto Analysis of issues impacting your business can enable you to separate the critical from the unimportant and become a very valuable tool in strategic planning as well. By breaking problems down into different views and then looking at the “big movers” of each view, you can see into the heart what matters and and set priorities accordingly. By creating Pareto charts for revenue and gross margin contributions to the overall business by product, by region, by market segment, etc., it is possible to get much clearer insight as to what is critical to business success, and what you can afford to defocus, ignore, or drop. The example shown here (purposefully) highlights the 80/20 rule – where in this case 30 percent of the portfolio is responsible for 80 percent of the revenue – highlighting the importance of the first three products and the relative irrelevance of the last 5 or 6. A similar chart could be plotted to understand regional revenue performance, performance by market segment, by customer type, by channel, or by any other interesting factor that might help to guide in understanding what is important, what is performing well, what is not, and what elements – in at least some cases – are irrelevant. Depending on what you are trying to learn, it may be more important to look at the same plots by gross margin contribution to assess the profitability of different revenue dollars by product, market, customer, region, etc.
While Pareto analysis like this can readily show where revenue or profits come from, such analysis can also be used to look for problem areas and to assess the strategic importance of eliminating these problems. If for example, in a plot of revenue by region, Europe is lower than, say, South America – there is likely some kind of significant problem in sales, channels, support, market localization or distribution in Europe as it is nominally a bigger market for most (non-South American) companies. But you have to be careful and think through the analysis. You should also ask yourself why some “bars” are not contributing. Is it because there is execution is bad, or because there is no market? That will take you down different path!
Alternatively, you could look for areas needing strategic improvement by plotting service call types, quality problems, inventory items, manufacturing defects, or many other operational metrics and clearly see areas that can be addressed as well also evaluate the impact that addressing these issues should have.
So, Pareto Analysis can help you see areas critical to nurture and maintain, investment areas with high potential, pieces of the puzzle that are working well, as well as real problem areas. All of this helps you to sharpen your focus on where to spend your time, money and energy, and to separate out what is noise. Creative use of Pareto Analysis is effective in execution and strategic priority management.
