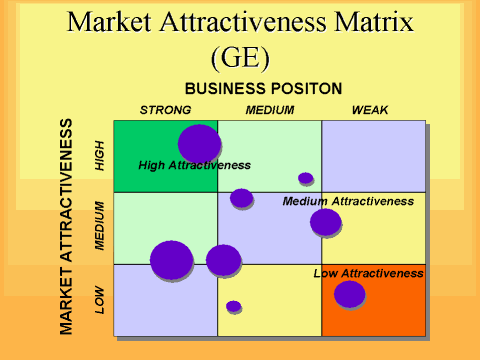
 McKinsey / GE Matrix Assessment – While it is a complementary assessment to the BCG model, I like this assessment better than the BCG matrix, even though it is more complicated. The interesting difference here is that here Market Attractiveness (common to the BCG model) is contrasted with the capabilities or position of the business in this market. This forces you to think about your overall business capabilities that make up your value chain and differentiate you. Again, with this model, you can assess where you are as the “current state” of your business and then assess various “future state” scenarios depending on what investments you make and what strategies you follow. One big problem with this model is that you have to watch out for subjectivity in creating the Business capabilities piece. It is easy to overstate skill, market sway and ability to change.
To make use of the model clearer, assume that you have one product (it could be a business unit) in the high attractiveness / high strength position. Per this model, you should do whatever you need to do to protect or even enhance this position. Playing out investment scenarios for this product should show further gains in business position strength and an increased “bubble size” assume that your investments grow revenues. Good.
But look at a few more examples. Assume that you have two more products – product one is in the high attractiveness / weak strength position (top right) and product two is in the medium attractiveness / medium strength position (middle / middle). By playing out various investment scenarios you can forecast multiple future states. Maybe with one investment alternative you can readily move product one into the high attractiveness / medium strength position, maybe even with momentum towards a high strength position – if you can do this, you should as you will have another star performer!
 Also, imagine that for product 2 you see two choices. First, with one investment you can push this “middle / middle” product into the medium attractiveness / high strength creating a new phase of growth and capturing a larger market share and larger profits. But with an alternative investment you could focus on product 2 process improvements only to improve margins. While this alternative might result in flat revenues, you would expect higher and perhaps dramatic gross margin gains on product 2. If you cannot afford to make both investments, which should you do? The answer is: it depends, and that is the beauty of this modeling. You should model the different alternatives and assess how your investments will pay off over time – the value of the model is that it provokes this thought provoking engagement to push you to deeper insight to make the best decisions.
It is worth further clarifying the Business Capabilities axis – this is a measure of your overall strength relative to this product or portfolio item. Because your business capabilities drive your business strength, focused thinking about strategic investments that build these capabilities over time is critical and an important part of investment trade-off considerations. You not only want to grow your “bubble size”, meaning revenues, but you also want to push your “capabilities” to the left. Here capabilities can mean engineering expertise, patents, trade secrets, improved marketing, partnerships, supply chain improvements, process improvements, selling channels, selling expertise or any number of pieces in your value chain that target for improvement. And, while this tool can provide valuable insight just by plotting estimated bubbles on the axis, if you use software to model your alternatives (excel templates for this tool are readily available), you can significantly improve your understanding of what investments will have the most dramatic impact on you future. You can look at your various strategic plan alternatives and compare expected revenue growth (total bubble volume), anticipated compounding to that growth (market attractiveness is proportional to higher growth rates), alternative improvements to your business capabilities (which may be complementary across products), and your concentration in highly attractive markets over time. Every time I have done this alone or with teams I have come away with new insights and ideas.
In practice, my product teams maintain a spreadsheet of alternative investments for prioritization (see the section on portfolio management) that can readily feed into the tools used in this analysis. Alternative investments can be added to the total plan until resources are exhausted, and evaluated with each other until you believe you have the optimum mix. It is essential to also recognize that too often strategic planning focuses on product or service development alone and this is wrong! Delivery, sales, quality, manufacturing, selling, marketing or any critical facet of your business are part of the whole product and should be considered for investment in this (or any of the other) model(s).
